Using Google Analytics Reports for Your Business
Using our (Foundation for Shared Impact, or “FSI”) own GA4 report as an example, we will cover the 7 most important types of GA4 reports and what valuable insights they can provide your business.
In each type, we will elucidate a) what the report tells you, and b) how to interpret and take action according to the report.
- Acquisition Overview Report
- Audience Overview Report
- Mobile Overview Report
- Landing Pages Report
- Goals Overview Report
- Site Speed Overview Report
- Or build your own custom report!
Important terms to be aware of:
- Goal Conversion= The completion of desirable interactions by website visitors, such as purchasing a product or completing a form from your website
- Bounce Rate= Percentage of single-page sessions, where users only visited a single webpage (the landing page) and left your website without exploring further
1. Acquisition Overview Report
a) What does Acquisition Overview tell you?
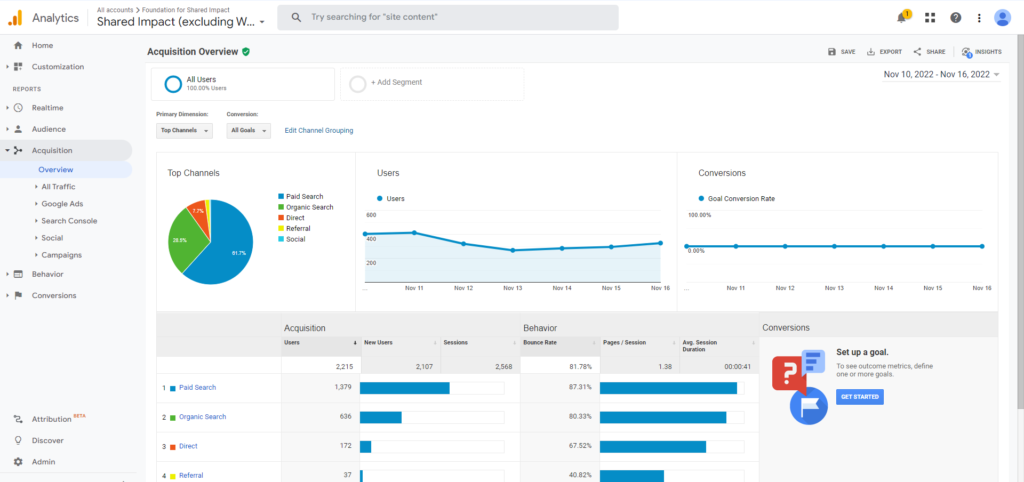
There are several different types of channels by which visitors arrive at your websites, such as direct, referral, social, paid search, and organic search. The Acquisition Overview report gives an excellent summary of visitor behavior, conversion rate, and the percentages of traffic coming from each channel over time. If you do need a more detailed report, you can dive deeper into other subsections under the “Acquisition” report, such as “Channels” (details about your website traffic from each channel), “Referrals” (which external websites are your visitors coming from), and more.
b) How to interpret the Acquisition Overview report?
As you can see from the image above, FSI is bringing in most of its users through paid and organic search, but attracting very little through social media, such as Instagram and Facebook. As a result, we can deduce that their social media is a weak link in terms of traffic generation and can be prioritized in their future marketing efforts.
2. Audience Overview Report
a) What does Audience Overview tell you?
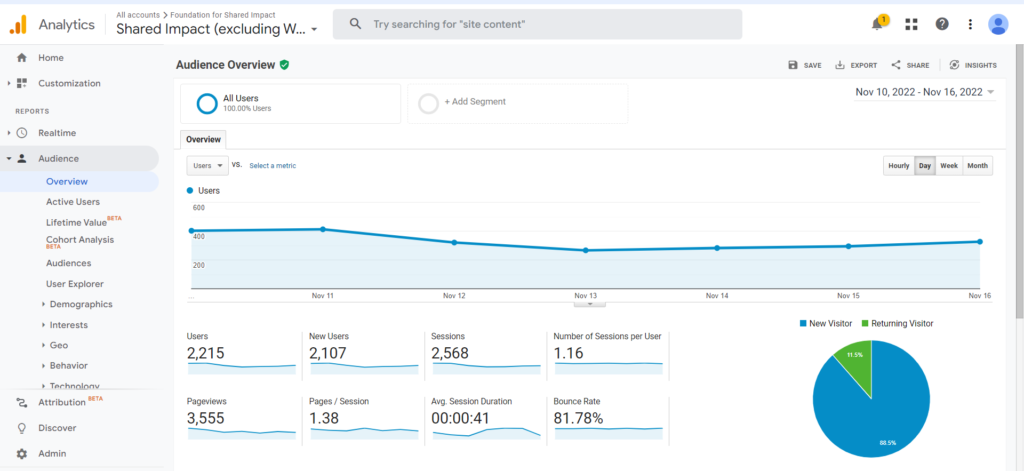
The Audience Overview report provides an overall snapshot of your website traffic:
- Users= the total number of visitors over a certain period of time
- New & Returning Visitors= the number & percentages of first-time and returning visitors
- Pages/ Session= the average number of webpages viewed during a session
- Bounce Rate= the percentage of single-page sessions in which users leave after only visiting a single webpage
- Average Session Duration= the average period of time when users are actively engaged by your website
- Demographic= the countries your visitors come from and the languages they may speak
b) How to interpret the Audience Overview report?
As seen in the image above, FSI attracts mostly new users, with an average of 1.16 sessions per user. The bounce rate is also very high, which means that there is a large percentage of website visitors leave the website after viewing only one page. This may mean that the website is attracting a lot of irrelevant audiences as viewers do not navigate to different pages on the website.
3. Mobile Overview Report
a) What does Mobile Overview tell you?
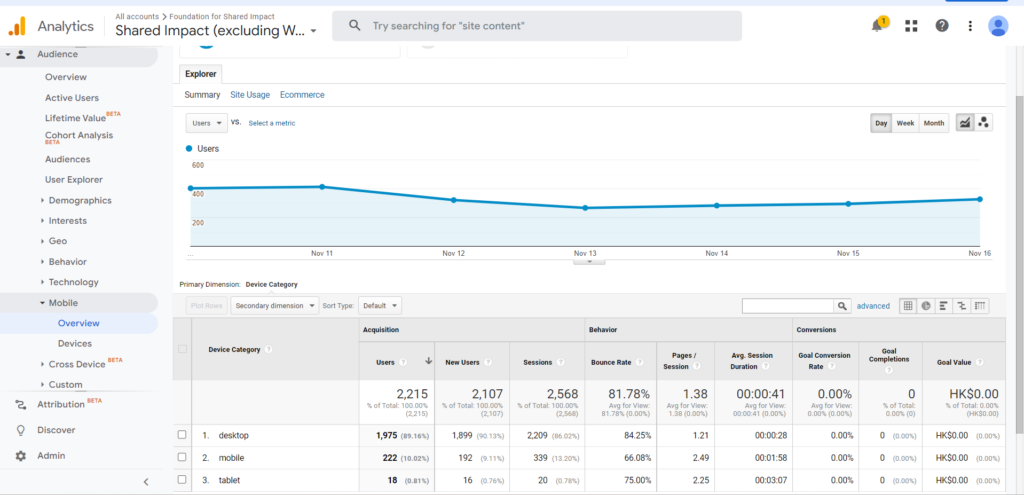
At any one point, millions of users are accessing the web through smartphones instead of computers, as we are currently living in a mobile-first world. As a result, it is important to see how well your website is optimized for mobile users’ experience, and where you can make improvements in order to improve its ease of accessibility. Furthermore, becoming a mobile-friendly website is also significant for your search engine optimization as Google will penalize websites that are not mobile-compatible by ranking them lower in search engine results.
b) How to interpret the Mobile Overview report?
Reviewing data from FSI, there are a large number of viewers that access the website through desktop applications rather than mobile phones. This can be seen from the percentage 89% shown of website visitors that use desktops. This could mean that the website might not look good on mobile and that further adaptation of the website is necessary.
4. Landing Pages
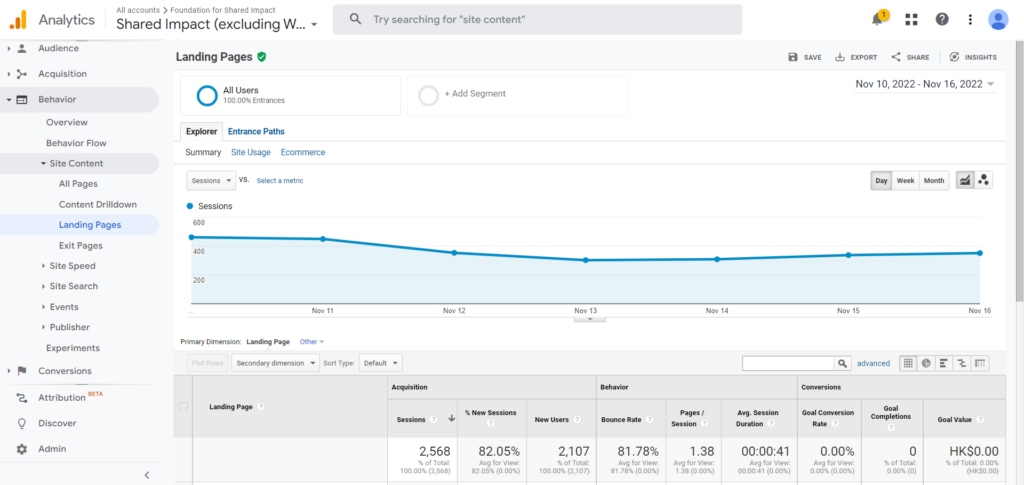
a) What do Landing Pages tell you?
Are you receiving your target group of visitors, and are their intentions aligned with your business goals? Which web pages are growing, and which are losing traffic? What web pages are users interacting most actively and frequently with? Which important web pages should be better optimized? All of these questions can be efficiently addressed using the Landing Pages report. Furthermore, this report also displays the bounce rate and total goal conversions of your website’s top landing pages. For a deeper understanding of what visitors do after they have landed on your website, you can head over to “Behavior Flow” in the Behavior section in order to track user behavior as they explore and interact with your website. Analyzing “Behavior Flow” can help you improve your website in order to capture potentially lost sales or leads, as well as identify webpages that provide the least to most value to your visitors.
b) How to interpret the Landing Pages report?
In the table below (not shown in the image), there will be a landing page breakdown that shows which webpages are visited most when users click on the website. Most of the time this is the homepage and the “about section”, but can differ depending on the products or services shown on your website. Landing pages that do not show often may be due to poor Search Engine Optimization (SEO) and may require further finetuning.
5. Goals Overview
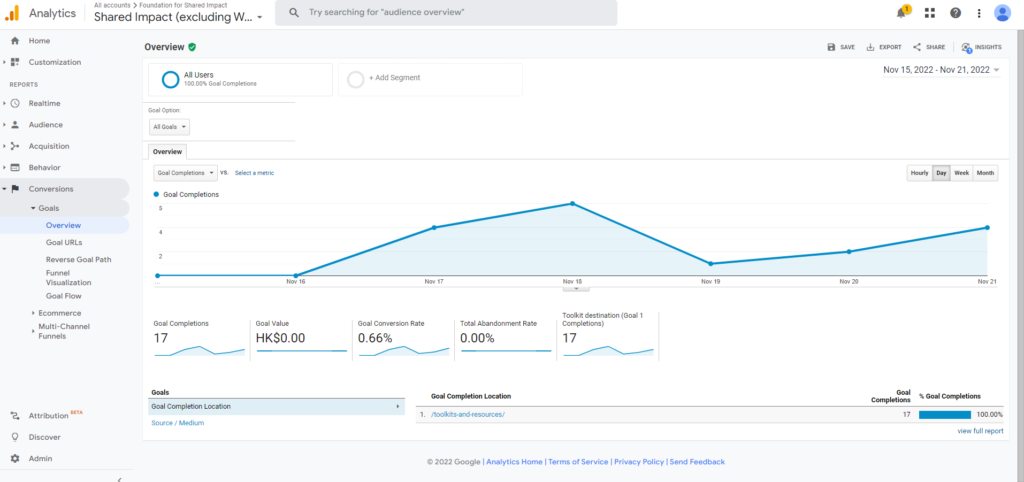
a) What does Goals Overview tell you?
The Goals Overview report is arguably one of the most important and straightforward reports in GA4, as it can help you directly track your website’s total number of goal completions and its goal conversion rates. Some common goals of business websites are to acquire more users, increase their total number of subscribers, and other specific interactions such as product purchases, form submissions, and form downloads.
But first, how do you create and set goals for your website? It is simple! Follow the instructions here in order to first create and set your goals.
b) How to interpret the Goals Overview report?
The goal report is set to a specific webpage – in this case, it is set to the number of website visitors of the “Toolkit” section of the FSI website. As we can see there are 17 goal completions from November 15 to November 22, and this shows that the toolkit section was visited 17 times during the period of one week. To improve this number, FSI can consider doing more promotion on social media, Ads on Google, or using other means of generating digital awareness.
6. Site Speed Overview Report
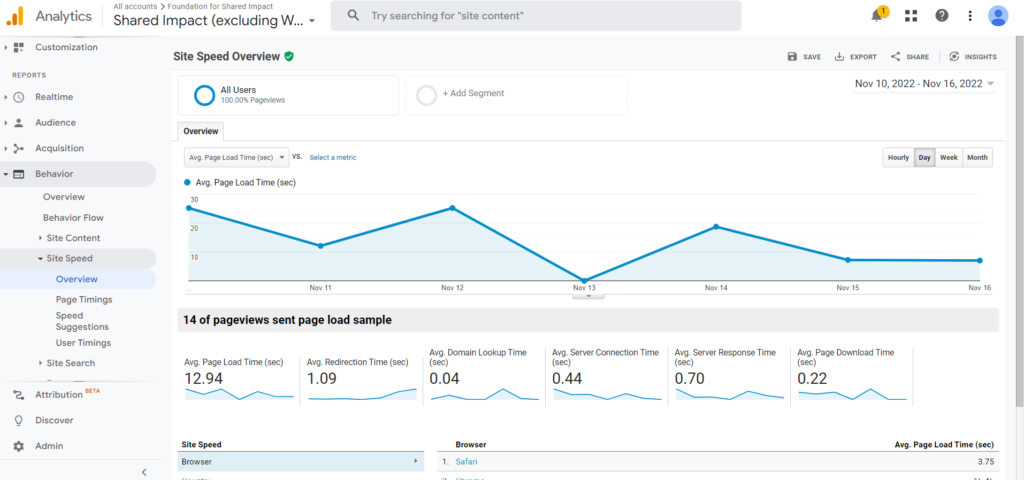
a) What does Site Speed Overview tell you?
Living in an increasingly digital world has made us expect nothing less than a near-instant response when web browsing. Similar to Mobile Overview, having a slow site speed will hurt you twice. First is lowering your rankings in organic Google search results, as site speed is an essential SEO metric. Second is by significantly increasing your website’s bounce rate, as visitors tend to leave a site immediately if it takes longer than a few seconds to load. With the Site Speed Overview report, you can analyze a few aspects of website latency, such as:
- Average page load time: The average amount of time (in seconds) it takes webpages to load, from clicking on a page link to completion of loading.
- Average server response time: The time needed for the user to connect to your server
- Average redirection time: The average time (in seconds) spent in redirection before fetching the page
b) How to interpret the Site Speed Overview report?
Looking at the image above, the average page load time is 12.94 seconds, which is very high considering that pages should not load for more than 2 to 3 seconds. This may mean that FSI has a large image or video formats that increase the page speed load time, and FSI may need to compress downloadable files, optimize its images and media, as well as increase server response time. Website developers can refer to this website to reduce page speed.
7. Or you can build your own custom report!
As a business owner, no one can tell you what success is except yourself. Building a personalized report, such as an SEO report or e-commerce traffic report, allows you to extract and analyze performance indicators most tailored to your company.
That’s it! With these reports, you will have a clear understanding of your audience and their behavior, and you should adjust your website and content accordingly to maximize the number of relevant users that visit your website!
If you are looking for ways to bring more people to your website, Google Ads is a flexible and effective method to do so. Read our guide below to set up Google Ads!
How to set up Google Ads and Conversion Tracking
Additional Resources
- Official help center for Google Analytics
- Most important GA4 Reports for E-commerce
- Best Google Analytics Custom Reports